
Introduction

Many of you might have known what a normal distribution is. If you do not know, please refer to the blog on a normal distribution. Here you will get learn how to use Microsoft Excel to find normal probabilities or critical values.
While making decisions using the Z
test, we need to find the p-value. Finding a p-value is the same as finding normal
probability for the given test statistic. To construct confidence intervals, we
need to find critical values.
Microsoft Excel is the tool that is easily available on almost all laptops and computers nowadays. This tool is specially used to make
calculations simpler.
Use of Microsoft excel to find normal probabilities
In hypothesis testing, we use the normal
distribution to test the claim about population mean (µ) if we know population
standard deviation (σ) in prior. In this situation, we use standard normal
distribution or Z distribution hence we call it as Z test. While using the Z test
we need to find the p-value for making decisions.
Before going to find normal
probabilities using excel, let us understand some facts about excel.
There is a
function in Microsoft excel called =NORMSDIST(z) to find standard normal
probabilities while the function =NORM.DIST(x, µ, σ, #) gives normal
distribution probabilities with mean µ and standard deviation σ. Both the
functions give the left tailed-probabilities. Within this function, # denotes
logical 0(FALSE) or 1(TRUE) value. Use logical 0(FALSE) if you need to find the
height of the normal curve at X=x. Use logical 1(TRUE) if you need to find the cumulative
probability at X=x.
How to call the function in excel?
There are three ways to call the function in an excel sheet. Below is the path for the function =NORMSDIST(z). Use the same path for functions =NORM.DIST(x, µ, σ, #).
- Simply select any cell in an excel sheet then type =NORMSDIST(z) then hit ENTER button.
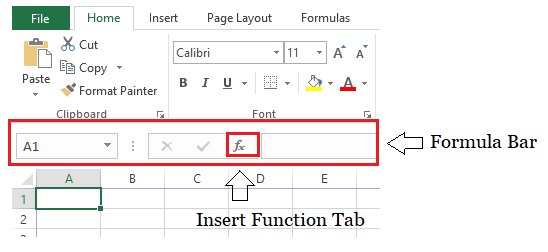
- Click on the
symbol of “Insert Function” present in the formula bar.
The new window of Insert Function will open. Then search for the function =NORMSDIST(z) in this window. - Go to the Formulas
menu at the top. Then click on the Insert Function tab in this menu.
The new window of Insert Function will open. Then search for the function =NORMSDIST(z) in this window.


Illustration
Suppose X be a normal random variable with a mean of 10 and a standard deviation of 5. Find P(X < 17.8), P(X > 17.8).
The excel function =NORM.DIST(17.8, 10, 5, TRUE) gives the left-tailed normal probability below X=17.8 that is equal to, 0.94062. This gives, P(X < 17.8) = 0.94062.
To get right-tailed
probability above X=17.8, we use the function =1-NORM.DIST(17.8, 10, 5, TRUE).
This gives, P(X > 17.8) = 0.05938.


Use of Microsoft excel to find critical values
While constructing a confidence interval, we need to find critical values. These critical values are Z scores
corresponding to the given probability. Before going to find critical values using
excel, let us understand some facts about excel.
There is a
function in Microsoft excel called =NORMSINV(p) to find standard normal
probabilities while the function =NORM.INV(p, µ, σ) gives normal
distribution probabilities with mean µ and standard deviation σ. Both the
functions take the left tailed probabilities p.
How to call the function in excel?
There are three ways to call the function in an excel sheet. Below is the path for the function =NORMSINV(p). Use the same path for functions =NORM.INV(p, µ, σ).
- Simply select any cell in an excel sheet then type =NORMSINV(p) then hit ENTER button.
- Click on the
symbol of “Insert Function” present in the formula bar.
The new window of Insert Function will open. Then search for the function =NORMSINV(p) in this window. - Go to the Formulas
menu at the top. Then click on the Insert Function tab in this menu.
The new window of Insert Function will open. Then search for the function =NORMSINV(p) in this window.


Illustration
Suppose you need to construct a 90% confidence interval for the population mean. Assume that you know the value of population standard deviation in prior. What is the critical value Z(α/2)?
The confidence level for 90% confidence interval is, 0.90. This gives, significance level (α) = 1-C = 1-0.90 = 0.10. The left tailed probability to the desired critical value Z(α/2) is, 1-(α/2) = 1-(0.10/2) = 1-0.05 = 0.95.
Then the excel
function =NORMSINV(0.95) gives the critical value Z(α/2) equals, 1.644854.

0 Comments
Post a Comment