
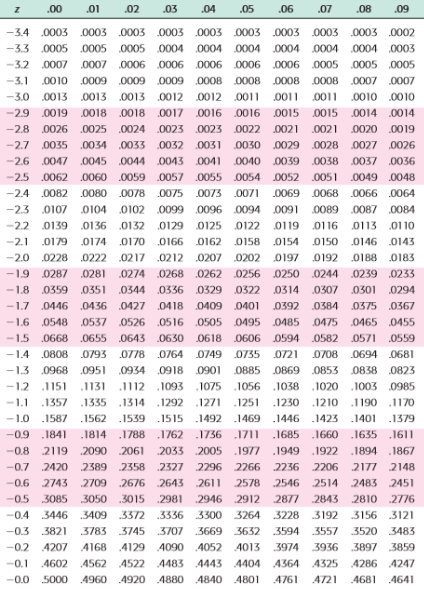
Z score table

Many of you might have known what a normal distribution is. If you do not know, please refer to the blog on the normal distribution. Once we get to know, what is a normal and standard normal distribution (Z distribution) here is the time to learn how to use the Z score table.
While constructing the
confidence intervals or making decisions in hypothesis testing, p-values and critical values
are essential. Finding a p-value is the same as finding normal probability for the
given test statistic. Before going to find normal probabilities and critical
values using the Z score table, let us understand some facts about the Z score
table.
Facts about Z score table
Z scores are the standardized
values that tell how many standard deviations above/below the value does is
from its mean. Use the following formula to find Z scores.

The Z score table gives the
left-tailed probabilities for the given Z score. Consider the following
snapshot of a Z score table.

Both the row heading and column-heading
club together to form a Z score. While the entries in the body of the table are
probabilities. You can find the probabilities if you have Z scores whereas you
can find Z scores if you know the probabilities. There are two types of Z score
tables, one with negative Z scores and another with positive Z scores.
Z score table with negative values
Z score table with positive values

Use of Z score table to find normal probabilities
Follow the steps below one by one.
- Find the Z score (Z0) for the given value (X0) and round it to the two decimal places. If you want to find a p-value then round the value of the test statistic to the two decimal places, say Z0.
- Then separate the Z0 to get row heading and column heading.
- Based on this, search for the value corresponding to the row header and the column head in the body of the table to get the desired probability.
- This gives P(Z < Z0) = P(X < X0).
Use the same procedure to find
the left-tailed probability using the Z score table with negative values.
Illustration
Suppose X be a normal random
variable with a mean of 10 and a standard deviation of 5. Find P(X < 17.8), P(X >
17.8).
Procedure
- The Z
score for the given value 17.8 is, 1.56 {Z0 = (17.8-10)/5 = 1.56}.
- Then separate the number 1.56 as, 1.5 (row head) and 0.06(column head).
- We search
for the value corresponding to row 1.5 and the column 0.06 in the body
of the table to get 0.9406.
- This
gives, P(Z < 1.56) = P(X < 17.8) = 0.9406.

P(X > 17.8) = 1 – P(X <
17.8) = 1 – 0.9406 = 0.0594.
Use of Z score table to find critical values
Follow the steps below one by one.
- Find the confidence level C. Then calculate the significance level (α) = 1-C.
- Calculate the left-tailed probability, 1-(α/2), below desired critical value say Z(α/2).
- Then search for the probability 1-(α/2) in the body of the table. Sometimes you may not find the exact value 1-(α/2), in this situation, search for the value that is close to 1-(α/2).
- Note down the row heading and column heading. Then just club these two headings to get desired critical value.
Illustration
Suppose you need
to construct a 90% confidence interval for the population mean. Assume that you know
the value of population standard deviation in prior. What is the critical value
Z(α/2)?
Procedure
- The confidence level 0.90. Then the significance level (α) = 1-0.90 = 0.10.
- The left-tailed probability = 1-(0.10/2) = 1-0.05 = 0.95.
- We need to search for the probability of 0.95 in the body of the table but there is not an exact value of 0.95. Two values 0.9495 and 0.9505 are close to 0.95.
- Note down the row headings and column headings. We get two values 1.64 and 1.65, which take average to get a critical value of 1.645.

0 Comments
Post a Comment